AmericanEtrader Menu

What is Constitutional Money With Dr. Edwin Vieira

Dr. Edwin Vieira


Congressional lecture on "What is Constitutional Money?", part two of a three part series on the basic principles of money for Congressional staff. As a continuing educational tool this lecture was filmed and is provided to the public. The lecture was delivered by Edwin Vieira, Jr., J.D., Ph.D, the author of the definitive work on Constitutional money, Pieces of Eight: The Monetary Powers and Disabilities of the United States Constitution. Dr. Vieira's lecture explores the development of the American monetary system from colonial times through the creation of the Federal Reserve System, explaining the constitutional underpinnings of our money and the erosion of that legal framework over 200+ years of monetary history. He also explains his plan to return to sound money, outlining the grim ramifications of continuing on a fiat money standard.

The World’s 10 Most Prolific Gold Fields

Gold has long been one of mankind’s most prized possessions. Yet most people have little idea where gold comes from, other than from “gold mines.”
Mining gold today often becomes monumental undertakings, truly some of man’s greatest engineering feats. Imagine gold mining shafts nearly two and a half miles below the surface and it taking two hours for miners to get to their work stations. Imagine a pit so large that it can be seen from outer space.
No reason to imagine, those are the realities in the mining of gold revealed in “The World’s 10 Most Prolific Gold Fields.”

1. Witwatersrand Basin (Johannesburg, South Africa)

The head frame of the Tau Tona Mine is the lone entrance to over 500 miles of tunnels.
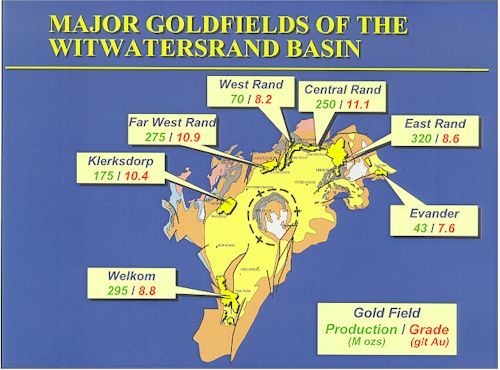
Located in South Africa, the Witwatersrand Basin represents the richest gold field ever discovered. It is estimated the 40% of all of the gold ever mined has come out of the Basin. In 1970, South Africa’s output accounted for 79% of the world’s gold production. By 2009, South Africa’s share of world gold production had dropped to less than 8%.

Mining in the Witwatersrand Basin is accomplished by creating deep underground tunnels that are necessary to reach the plentiful reserves. The Tau Tona Mine features the deepest tunnel in the world extending a full 2.4 miles below the earth’s surface. A massive ventilation and air conditioning system is required to overcome the extreme working conditions throughout the over 500 miles of tunnels. At its deepest levels, the air temperature reaches 131 F and the rock face itself 140 F. The mine is so extensive that it takes workers a full two hours to travel from the surface to the deepest sections of the mine where they must then contend with pockets of lethal gas, water and a continual barrage of small earthquakes.

The discovery of gold in the Basin in 1886 by Australian miner George Walker set off one of the largest gold rushes in history. The surrounding area became the city of Johannesburg, and within ten years Johannesburg was the largest city in South Africa. The huge influx of foreigners (mostly British) created resentment among the Boer (prior Dutch settlers). Imposition of heavy taxes and restriction of voting rights by the Boer led to the Second Boer War in 1899.
Sources
http://www.mbendi.com/indy/ming/gold/af/sa/p0005.htm
http://en.wikipedia.org/wiki/Gold
http://siowwf.blogspot.com/2009/05/tautona-deepest-gold-mine-in-world.html
http://en.wikipedia.org/wiki/Witwatersrand_Gold_Rush
National Geographic documentary Megastructures: Tau Tona City of Gold.
Kitco.com

2. Carlin Trend (Nevada, US)

A large open pit excavation at the Twin Creeks Mine in the Carlin Trend.
For over a hundred years, prospectors in the Western US completely missed one of the richest gold fields in the world as it contained what is now popularly called ‘invisible gold.’ Historically, most gold fields were discovered by the presence of gold veins or deposits visible to the naked eye. Not so in the Carlin Trend located in northeast Nevada. Hot springs containing dissolved gold deposited the metal into the sediment in such fine particles that it is difficult to see even with a microscope and impossible to find using older conventional methods such as hand tools and panning.

In 1961, John Livermore, a geologist for Newmont Mining, set out in search of this invisible gold based on some ideas in a paper published a year before by noted geologist Ralph Roberts. It didn’t take long before Livermore found what he was looking for in an area that is now known as the Carlin Trend. The deposit was the first major one of its kind discovered. Subsequent discoveries of similar type areas in China and Macedonia are referred to as Carlin Trend type deposits.
Mining by Newmont began in 1965; the area has since become one of the richest gold fields in the world. Open pit mining dominates the Carlin Trend over its five by 40 mile area although some underground operations have been formed in higher grade areas.
Gold production in the state of Nevada, which is dominated by the Carlin Trend, accounts for almost 80% of the gold mined in the United States. If Nevada were a country, it would rank #4 in the world in terms of total gold production.
Sources
http://www.mining-technology.com/projects/carlin/
http://en.wikipedia.org/wiki/Carlin-type_gold_deposit
http://www.mining-technology.com/projects/carlin/
http://en.wikipedia.org/wiki/Carlin_Unconformity
http://www.mininghalloffame.org/inductee.asp?i=156&b=inductees.asp&t=n&p=L&s=
http://www.time.com/time/magazine/article/0,9171,958839-1,00.html
Photos: globalwarming-arclein.blogspot.com

3. Irian Jaya (Indonesia)

The Grasberg Mine’s opening is 1 mile in diameter.
In one of the most inaccessible spots on the planet lie the single largest gold ore body and third largest copper ore body ever discovered. Located in the mountains of Irian Jaya, Indonesia, at an elevation of 14,010 ft, is the Grasberg Mine. Two miles away lies its predecessor, the Ertsberg Mine. The amazing feat of their construction by Freeport McMoRan is the subject of an episode of Discovery Channel’s Super Structures.

Work on the original Ertsberg Mine began in 1967 with the construction of a dock and a 25 mile road through the surrounding jungle. Chain saw wielding workers were lowered from helicopters to cut their way clear to the jungle floor. Bulldozers were flown in where they often had to contend with 20 feet of soft marshland before reach solid ground. The final section of mountain road was built atop a ridge so narrow that the first clearing pass had to be done with bulldozers no bigger than riding lawn mowers. Six subsequent iterations of air lifting increasingly larger bulldozers were used to complete the road. A tram system had to be built to surmount the final 2,000 foot cliff that separates the road from the mine site.
Satellite photo of Gold Field.
Getting the mined ore off of the mountain is a much more efficient process: it is simply dropped 2,000 feet to the giant crushers below. The processed ore is mixed with water to create a gold and copper slurry which travels through 70 miles of pipe out to the shore. From there, the slurry is concentrated and the ore then transported to smelters around the world.

The original Ertsberg Mine operated from 1972 until it was depleted in the mid 1980s. In 1988, Freeport McMoRan discovered the enormous neighboring ore body that is today operating as the Grasberg Mine. Gold production was 2.5 million ounces in 2009. Open pit operations will continue through 2015 at which point the gold will be mined by underground methods.
Sources
http://en.wikipedia.org/wiki/Grasberg_mine
http://www.novariant.com/mining/documents/International_Magazine_2009_12.pdf
Grasberg: Gold Mine in the Sky. Super Structures. Discovery Channel
http://www.thejakartaglobe.com/business/indonesian-freeports-grasberg-mine-records-big-fall-in-output/405163
Photos: http://www.flickr.com/photos/skytruth/sets/72157619423822183/

4. The Super Pit (Kalgoorlie, Western Australia)

The Super Pit
A view of the Super Pit from a turn off on the Goldfields Highway.
The Super Pit, located in Kalgoorlie, Western Australia, is the largest open pit mine in the country. It covers an area of almost three square miles and is large enough to be seen from space. The excavation began after several underground mines were acquired by Kalgoorlie Consolidated Gold Mines. Even today, operations occasionally unearth old mining tunnels complete with abandoned mining equipment.

The Super Pit covers an area known as the Golden Mile, a name that dates back to the original gold rush of the late 19th century. During this time, the field was considered to be the richest square mile in the world. The area has been continually mined for over 100 years, and the Super Pit is expected to remain in production through at least 2017. Once retired, the mine will be allowed to fill in with ground water, a process that could take 50 years.
Super Pit Gold Field
The 11th million ounce gold pour underway (Nov. 2006)
The city of Kalgoorlie was formed in 1893 right after Irishman Paddy Hannan filed a Reward Claim leading to an influx of hopeful prospectors. The subsequent gold rush saw the surrounding area boom over the next 10 years, temporarily reaching a population of almost 200,000. It was during this time that Kalgoorlie’s famous Hay Street brothels began. Much like the mine, they have also been in continuous operation for over a century and are now an accepted part of the community. Today, Kalgoolrie has a population of less than 30,000 with about one fourth of its jobs directly related to mining.
Sources
http://www.mbendi.com/indy/ming/gold/au/au/p0005.htm
http://goldoz.com.au/172.0.html
http://www.nullarbornet.com.au/towns/kalgoorlie.html
http://en.wikipedia.org/wiki/Kalgoorlie,_Western_Australia
http://www.itourist.com/guides/destinations/article/110057
Photos: http://www.superpit.com.au/PhotoLibrary/Processing/tabid/177/Default.aspx

5. Yanacocha (Peru)

Yanaccocha
Located high in the Andes Mountains, with parts reaching elevations in excess of 13,000 feet, lies the sprawling complex known as Yanacocha. Covering some 60 square miles, it is the largest gold mine in Latin America, possibly the second largest in the world, and is recognized as one of the most profitable in the world. Yanacocha is the largest facility operated by Newmont Mining and is the company’s crown jewel. With almost $2 billion dollars invested in the mine, Newmont has received a return of over $7 billion to date.
Yanaccocha
In 1994, a legal battle for Yanacocha erupted between Newmont Mining and its French partner BRGM after BRGM attempted to sell its stake to a Newmont rival. A controversial decision by the Peruvian high court allowed Newmont and its Peruvian partner Buenaventura to buy out BRGM’s stake. The aftermath was ugly with both sides accusing one another of engaging in improper conduct in attempting to influence the decision.
Since its origins in 1993, Yanacocha has produced more than 26 million ounces of gold.
Sources
Peru: The Curse of Inca Gold. Frontline World. 2005. http://www.pbs.org/frontlineworld/watch/player.html?pkg=404_peru&seg=1&mod=0
http://www.nytimes.com/2005/10/25/international/americas/25GOLD.html?pagewanted=1&_r=1
http://www.nodirtygold.org/cajamarca_peru.cfm
http://www.mbendi.com/indy/ming/gold/sa/pe/p0005.htm
Photos: http://en.wikipedia.org/wiki/Yanacocha

6. Gold Country (California, United States)

Gold Country
The Kennedy Gold Mine which operated from 1870 until 1942.
Gold Country is the casual name given to the area on the western slope of the Sierra Madre Mountains extending along what today is Highway 49 in California. It was the discovery of gold here in the tailrace at Sutter’s Mill that triggered the famous California Gold Rush of 1848-1855. Within only a few years of the discovery, nearly 300,000 people made the trek to California to seek their fortunes. San Francisco grew from a population of 1,000 to 25,000 by 1850.
Initially, prospectors focused on panning for gold but later moved to hydraulic mining in which pressurized water was used to loosen sediment along slopes and cliffs for processing. It is estimated that some 20 million ounces of gold was collected using these labor intensive methods.
Gold Country
The Kennedy Gold Mine which operated from 1870 until 1942.
Eventually, the gold rush period gave way to conventional hard rock mining. This required the intensive capital investment provided by companies. Mines in the area continued to operate up through WWII when the government forced their closure to direct resources for the war effort. One such operation was the Kennedy Gold Mine in Jackson, which by 1920 contained a remarkable 150 miles of underground tunnels reaching depths of 5,912 ft. After the war the mine lay dormant until 1961 when the 152 acre property was purchased by a ceramics teacher for $41,600 who lived there until her death in 1994. Now, it is preserved as a historical site.
When the price of gold soared in the 1970s, interest in the area renewed and several mines were opened using the more modern method of open pit mining. In some cases older tunnel mines were excavated. By the late 1980s, most of these mines had ceased operations due to the depressed price of gold. One in particular, the Harvard Mine near Jamestown, continued operations until 1995 with production in excess of 100,000 ounces of gold per year.
Sources
http://virtual.yosemite.cc.ca.us/ghayes/goldrush.htm
http://www.kennedygoldmine.com/files/history2s.pdf
http://en.wikipedia.org/wiki/California_Gold_Rush
http://en.wikipedia.org/wiki/Gold_country

7. Homestake Mine (South Dakota, United States)

Homestake Mine
An early picture from the interior of the Homestake Mine (date unknown).
When the Homestake Mine of Lead, South Dakota ceased operations in 2002, it was the largest and deepest gold mine in the Western hemisphere. Total output over 125 years of continuous production amounted to nearly 40 million ounces of gold.

The Homestake Mining Company was formed in 1877 when George Hearst, father of media mogul William Randolph Hearst, purchased the initial 10-acre claim for $70,000. Through a relentless series of acquisitions, he eventually secured control of 8,000 acres. During this time more than one person who refused to sell a claim or spoke out against him met with violence. In one case an uncooperative claim owner was killed by a Homestake Mining employee, who was later acquitted after the witness disappeared. The HBO series Deadwood is the fictionalized account of this period.
Homestake Mine Guard
Homestake Gold Mine guard with gold bars 1936
The Homestake Mine was also the site of significant research in particle physics. In the late 1960s, Raymond Davis Jr. headed up the team that was the first to successfully detect and count solar neutrinos using a large collector located deep in the mine. These experiments operated continuously until 1994. In 2002, Davis shared the Nobel Prize in Physics for his work at the Homestake site.
In 2007, the National Science Foundation gave its approval to build the Deep Underground Science and Engineering Laboratory (DUSEL) in the Homestake Mine utilizing its full 8,000ft depth for research. As of 2011, no construction date has been set.
Sources
http://www.homestakevisitorcenter.com/
http://www.int.washington.edu/DUSEL/story.html
http://en.wikipedia.org/wiki/Homestake_Mine_(South_Dakota)
http://en.wikipedia.org/wiki/George_Hearst
http://en.wikipedia.org/wiki/Deep_Underground_Science_and_Engineering_Laboratory

8. Lihir Island (Papa New Guinea)

Lihir Gold Field
Aerial shot of the Lihir Gold Mine.
In just how exotic and remote of a location can you find one of the world’s largest gold mines? If you start from Port Moresby, Papua New Guinea and head 500 miles northeast across the Bismarck Sea you will reach the tiny Lihir Island on the other side of New Ireland. It is on the east side of the island that Newcrest Mining operates its appropriately named Lihir Gold Mine.

The island’s 125 square mile area was formed from a volcano rising 2,300 feet above sea level. Gold was initially discovered during explorations in 1983, and production began in 1997. With operations so close to the water table, large bore pumps must be used to keep the mine from flooding.
The mine itself is located over an active geothermal area. Holes have been drilled to relieve the pressure and the gases are used to power a generator which supplies 75% of the mines energy requirements. Future expansions include the possibility of using the geothermal energy to power 100% of the facility.

Improvements to the mine should allow it to produce one million ounces of gold per year through 2020. It will then switch over and spend the next 17 years processing stockpiled lower grade ore. Total resources are estimated at 40 million ounces.
Sources
http://antigoldgreece.wordpress.com/2009/02/07/canadian-companies/
http://en.wikipedia.org/wiki/Lihir_Island
http://www.miningweekly.com/article/lihir-gold-says-png-expansion-to-over-1mozy-on-schedule-2010-07-28
http://www.mining-technology.com/projects/lihir/

9. Dawson City (Yukon Territory, Canada)

Dawson City
Gold Dredge #4 which operated in the Yukon from 1913 to 1959.
In July 1897, the newspapers in San Francisco picked up the story of miners from the Yukon arriving at the dock with bags of newly mined gold. From that point, the Klondike Gold Rush was on. Over 100,000 hopeful ‘stampeders’ set out on the perilous journey to Dawson City, but only about 30,000 ultimately made it.

The trek to the Yukon began with an easy boat trip from the US west coast to Skagway in Alaska. However, from there the stampeders had to cross the incredibly steep Chillkoot Pass — a staircase made of ice and snow that rose 1,000 ft in the last ½ mile, making the pass impossible for pack horses. Miners had to carry up their supplies over multiple trips.

Making this task all the more difficult was the fact that the Royal Canadian Mounted Police would not allow anyone to enter Canada without a year’s worth of food and supplies. This amounted to 2,000 lbs per stampeder. For those who actually made it over the pass, a three-week 500 mile boat trip up Benett Lake to Dawson City awaited them. The only problem was the stampeders actually had to construct their own boats or rafts on the spot. Many broke apart on the rapids.

Mining for gold in the Yukon was as difficult as getting to the Yukon. Most of it was located ten or more feet underground. Digging could only be done in the summer and even then a hard layer of permafrost had to be breached first. Temperatures in the winter reached -60F.

In the early 1900s, commercial dredgers began to dominate the area. These were large floating mines that scooped material off the river bottoms onto screens where the heavier gold could be separated. Waste material was the discarded out the back. Up to 24 of these dredgers operated in the Yukon all the way up until the 1950s. It is estimated that some 12.5 million ounces of gold was recovered from the area.
Sources
http://www.questconnect.org/ak_gold_dredges.htm
http://www.questconnect.org/ak_klondike.htm
http://en.wikipedia.org/wiki/Klondike_Gold_Rush

10. Hishikari MIne (Japan)

Hishikari Gold Mine
A miner poses in front of a massive gold vein at the Hishikari Mine.
In the 13th century, Marco Polo described Japan as ‘the land of gold’ based on what he perceived as plentiful displays of gold throughout the King’s palace and stories from traveling Muslim traders. Historically, most of Japan’s gold was produced from only two mines and by the early 1980s there was virtually no commercial gold production in the country.

That changed in 1981 when Sumitomo Metal Mining Co. discovered the highest grade gold ore deposits in the world in what would become the Hishikari Mine. In mining exploration, the rule of thumb is three ore strikes for every 1,000 test bores drilled. When Sumitomo drilled 21 bores in the area all 21 came up with strikes – and not just any ore — the gold concentrations averaged six to ten times higher than that typically seen in commercial gold mines.
Hishikari Aerial View
The Hishikari mine is located in this valley in northern Kagoshima Prefecture. The hot water seeping into mineshafts is supplied to the nearby hot spring spa.
The secret to these ultra high concentrations lay in Japan’s unique volcanic geology. Over the last million years, rising pockets of magma and hydrothermal fluid deposited massive vertical veins of gold and quartz. These veins can run more than three feet wide, 400 feet high and 325 feet deep. So far, 87 of these veins have been mapped out at Hishikari.

In just the last 25 years, output from the Hishikari Mine has more than doubled the previous 400 hundred years of production from Japan’s two formerly largest mines and new reserves are still being discovered there today.
Sources
http://web-japan.org/nipponia/nipponia45/en/feature/feature11.html
http://search.japantimes.co.jp/cgi-bin/fl20011028a1.html
http://web-japan.org/nipponia/nipponia45/en/feature/feature10.html
http://www.mbendi.com/indy/ming/gold/as/jp/p0005.htm
http://web-japan.org/nipponia/nipponia45/en/feature/index.html

Copyright 2011 CMI Gold & Silver, Inc.
If you wish to distribute or share the contents of this article please do so by attributing CMI Gold & Silver, Inc. with a link back to this article.


Posted by
Paul Carter on March 31st, 2011

Trackback URL for this post:
http://www.cmi-gold-silver.com/blog/10-most-prolific-gold-fields-in-the-world/trackback/

Audit of the Federal Reserve Reveals $16 Trillion in Secret Bailouts


Audit of the Federal Reserve Reveals $16 Trillion in Secret Bailouts
Send this article to a friend:

The first ever GAO(Government Accountability Office) audit of the Federal Reserve was carried out in the past few months due to the Ron Paul, Alan Grayson Amendment to the Dodd-Frank bill, which passed last year. Jim DeMint, a Republican Senator, and Bernie Sanders, an independent Senator, led the charge for a Federal Reserve audit in the Senate, but watered down the original language of the house bill(HR1207), so that a complete audit would not be carried out. Ben Bernanke(pictured to the right), Alan Greenspan, and various other bankers vehemently opposed the audit and lied to Congress about the effects an audit would have on markets. Nevertheless, the results of the first audit in the Federal Reserve’s nearly 100 year history were posted on Senator Sander’s webpage earlier this morning.

What was revealed in the audit was startling:
$16,000,000,000,000.00 had been secretly given out to US banks and corporations and foreign banks everywhere from France to Scotland. From the period between December 2007 and June 2010, the Federal Reserve had secretly bailed out many of the world’s banks, corporations, and governments. The Federal Reserve likes to refer to these secret bailouts as an all-inclusive loan program, but virtually none of the money has been returned and it was loaned out at 0% interest. Why the Federal Reserve had never been public about this or even informed the United States Congress about the $16 trillion dollar bailout is obvious - the American public would have been outraged to find out that the Federal Reserve bailed out foreign banks while Americans were struggling to find jobs.

To place $16 trillion into perspective, remember that GDP of the United States is only $14.12 trillion. The entire national debt of the United States government spanning its 200+ year history is "only" $14.5 trillion. The budget that is being debated so heavily in Congress and the Senate is "only" $3.5 trillion. Take all of the outrage and debate over the $1.5 trillion deficit into consideration, and swallow this Red pill: There was no debate about whether $16,000,000,000,000 would be given to failing banks and failing corporations around the world.

In late 2008, the TARP Bailout bill was passed and loans of $800 billion were given to failing banks and companies. That was a blatant lie considering the fact that Goldman Sachs alone received 814 billion dollars. As is turns out, the Federal Reserve donated $2.5 trillion to Citigroup, while Morgan Stanley received $2.04 trillion. The Royal Bank of Scotland and Deutsche Bank, a German bank, split about a trillion and numerous other banks received hefty chunks of the $16 trillion.

"This is a clear case of socialism for the rich and rugged, you’re-on-your-own individualism for everyone else." - Bernie Sanders (I-VT)

When you have conservative Republican stalwarts like Jim DeMint(R-SC) and Ron Paul(R-TX) as well as self identified Democratic socialists like Bernie Sanders all fighting against the Federal Reserve, you know that it is no longer an issue of Right versus Left. When you have every single member of the Republican Party in Congress and progressive Congressmen like Dennis Kucinich sponsoring a bill to audit the Federal Reserve, you realize that the Federal Reserve is an entity onto itself, which has no oversight and no accountability.

Americans should be swelled with anger and outrage at the abysmal state of affairs when an unelected group of bankers can create money out of thin air and give it out to megabanks and supercorporations like Halloween candy. If the Federal Reserve and the bankers who control it believe that they can continue to devalue the savings of Americans and continue to destroy the US economy, they will have to face the realization that their trillion dollar printing presses will eventually plunder the world economy.

The list of institutions that received the most money from the Federal Reserve can be found on page 131 of the GAO Audit and are as follows..

Citigroup: $2.5 trillion ($2,500,000,000,000)
Morgan Stanley: $2.04 trillion ($2,040,000,000,000)
Merrill Lynch: $1.949 trillion ($1,949,000,000,000)
Bank of America: $1.344 trillion ($1,344,000,000,000)
Barclays PLC (United Kingdom): $868 billion ($868,000,000,000)
Bear Sterns: $853 billion ($853,000,000,000)
Goldman Sachs: $814 billion ($814,000,000,000)
Royal Bank of Scotland (UK): $541 billion ($541,000,000,000)
JP Morgan Chase: $391 billion ($391,000,000,000)
Deutsche Bank (Germany): $354 billion ($354,000,000,000)
UBS (Switzerland): $287 billion ($287,000,000,000)
Credit Suisse (Switzerland): $262 billion ($262,000,000,000)
Lehman Brothers: $183 billion ($183,000,000,000)
Bank of Scotland (United Kingdom): $181 billion ($181,000,000,000)
BNP Paribas (France): $175 billion ($175,000,000,000)
and many many more including banks in Belgium of all places

View the 266-page GAO audit of the Federal Reserve(July 21st, 2011): http://www.scribd.com/doc/60553686/GAO-Fed-Investigation
Source: http://www.gao.gov/products/GAO-11-696
FULL PDF on GAO server: http://www.gao.gov/new.items/d11696.pdf
Senator Sander’s Article: http://sanders.senate.gov/newsroom/news/?id=9e2a4ea8-6e73-4be2-a753-62060dcbb3c3

Origanal Article taken from : http://www.silverbearcafe.com/private/10.11/gaoaudit.html
www.unelected.org


Send this article to a friend:

BBC Speechless As Trader Tells Truth: "The Collapse Is Coming...And Goldman Rules The World"


Uploaded by fal2grace on Sep 26, 2011


BBC News—Sept. 26, 2011— New CNN interview: http://www.cnn.com/2011/09/28/world/europe/uk-trader-viral/

Steve Jobs Will Live on Forever .... R.I.P

Steve Jobs, counted among the greatest American CEOs of his generation, died on Wednesday at the age of 56, after a years-long and highly public battle with cancer and other health issues.


God Bless Rest in Peace

Who's to blame ...? Capitalism vs Socialism

Timeline shows Bush, McCain warning Dems of financial and housing crisis; meltdown 

Uploaded by on Sep 24, 2008
The Bush Admin and Senator McCain warned repeatedly about Fanny Mae and Freddy Mac and what thus became the 2008 financial crisis -- starting in 2002 (and actually even earlier -- in the Clinton and Carter White Houses. Democrats resisted and kept to their party line, extending loans to people who couldn't afford them -- just like you would expect of socialists. See our web site for more.

Capitalism vs Socialism 

Uploaded by on Mar 23, 2008
Which is more productive?

Ronald Reagan speaks out on Socialized Medicine - Audio 

Uploaded by on Jul 23, 2009
Ronald Reagan speaks out on Socialized Medicine, circa 1961. Audio file.

A massive windfall for $FMCC $FNMA ...?

FHFA Sues 17 Banks Over Massive Mortgage Losses At Fannie and Freddie

1. Ally Financial Inc. f/k/a GMAC, LLC ($6 billion)
2. Bank of America Corporation ($5 billion)
3. Barclays Bank PLC ($4.9 billion)
4. Citigroup, Inc ($3.5 billion)
5. Countrywide Financial Corporation ($26.6 billion, Countrywide was bought by Bank of America)
6. Credit Suisse Holdings (USA), Inc
7. Deutsche Bank AG ($14.2 billion)
8. First Horizon National Corporation ($883 million)
9. General Electric Company ($549 million)
10. Goldman Sachs & Co. ($11.1 billion)
11. HSBC North America Holdings, Inc. ($6.2 billion)
12. JPMorgan Chase & Co. ($33 billion)
13. Merrill Lynch & Co. / First Franklin Financial Corp. ($24.8 billion)
14. Morgan Stanley
15. Nomura Holding America Inc. ($2 billion)
16. The Royal Bank of Scotland Group PLC ($30.4 billion)
17. Société Générale ($1.3 billion)


6Months Daily Charts

$FMCC FREDDIE MAC (OTC BB: FMCC.OB )


$FNMA FANNIE MAE (OTC BB: FNMA.OB ) Federal National Mortgage Association


Edward DeMarco: "Maintaining Housing Finance in a World of Uncertainty" 

Uploaded by on May 12, 2011


5Year Weekly Charts


Description
Federal Home Loan Mortgage Corp is a Government-sponsored enterprise (GSE), which conducts business in the United States residential mortgage market and the global securities market under the direction of its Conservator, Federal Housing Finance Agency (FHFA). The Company conducts its operations solely in the United States and its territories, and do not generate any revenue from or have assets in geographic locations outside of the United States and its territories. The Company provides liquidity, stability and affordability to the United States housing market primarily by providing its credit guarantee for residential mortgages originated by mortgage lenders and investing in mortgage loans and mortgage-related securities. It uses mortgage securitization as an integral part of its activities. The primary Freddie Mac guaranteed mortgage-related security is the single-class PC. Its operations consist of three segments: Single-family Guarantee, Investments and Multifamily.

Description
Federal National Mortgage Association (Fannie Mae) is a government-sponsored enterprise (GSE) chartered by the United States Congress to support liquidity and stability in the secondary mortgage market, where mortgage-related assets are purchased and sold. Its activities include providing market liquidity by securitizing mortgage loans originated by lenders in the primary mortgage market into Fannie Mae mortgage-backed securities (Fannie Mae MBS), and purchasing mortgage loans and mortgage-related securities in the secondary market for its mortgage portfolio. Fannie Mae operates in three business segments: Single-Family business, Multifamily Business (formerly Housing and Community Development (HCD)) and Capital Markets group. Its Single-Family and Multifamily businesses work with its lender customers to purchase and securitize mortgage loans customers deliver to the Company into Fannie Mae MBS.


Edward J. DeMarco Acting Director Federal Housing Finance Agency
MBA’s National Mortgage Servicing Conference & Expo Dallas, Texas

The Federal Housing Finance Agency’s Efforts Related to Mortgage Servicing

I would like to thank the Mortgage Bankers Association for inviting me to speak here
today.

As we all know, a few weeks ago the Administration issued a report on reforming the
housing finance market. In that report the Administration set forth some options to
consider for the long-term structure of housing finance. In the near-term the
Administration also set forth a number of recommendations to reduce the overall
presence of the government in the mortgage market, which would provide opportunities
for private capital to return to the market.

As debate over the future of the housing finance system progresses, the Federal Housing
Finance Agency (FHFA) will remain focused on meeting the goals of the
conservatorships, which include retaining value in the business operations of Fannie Mae
and Freddie Mac (Enterprises) and maintaining their support for the housing market. We
look forward to considering the near-term options discussed in the Administration’s
report consistent with our responsibilities as conservator and regulator.

As the Enterprises continue operating in conservatorship, FHFA has directed them to
undertake some joint initiatives to strengthen certain business operations. In our view,
these initiatives have value not only for the Enterprises’ operations, but also for the
broader mortgage market, regardless of the ultimate outcome of housing finance reform.
In other words if certain changes can be made that better the overall functioning of the
mortgage finance system, we should try to move forward on those changes now.
One of those initiatives is the Loan Quality Initiative (LQI). Under the LQI, FHFA
directed the Enterprises to undertake the development of standards to improve the
consistency, quality, and uniformity of data that are collected at the front end of the
mortgage process. By identifying potential defects at the front end of the mortgage
process, the Enterprises will improve the quality of mortgage purchases, which should
reduce repurchase risk for originators. The LQI is moving forward and will be phased in
over the course of this year and next.

More recently, FHFA announced the Joint Servicing Compensation Initiative. On
January 18

th, FHFA directed Fannie Mae and Freddie Mac, in coordination with FHFA


and the Department of Housing and Urban Development, to consider alternatives for
future mortgage servicing compensation for their single-family mortgage loans. The
goals of the joint initiative are to improve service for borrowers, reduce financial risk to
servicers, and provide flexibility for guarantors to better manage non-performing loans,
while promoting continued liquidity in the To Be Announced mortgage securities market.
To meet these goals, any change to mortgage servicing compensation must take account
of a number of factors. Among these factors are:

(1) Maintaining liquidity and consumer choice in the mortgage market.
Everybody from borrowers, to originators, to investors has an interest in ensuring
liquidity and consumer choice in the mortgage market. Maintaining liquidity in the
mortgage market allows originators to offer borrowers the best market rates. Investors
have often viewed the current mortgage compensation structure as providing some
protection against excessive refinancing solicitation, thereby helping to make prepayment
speeds more predictable. Whether or not that remains the case today, and the impact of
various alternative compensation structures, is an issue that the joint initiative will be
looking at closely.

(2) Ensuring that the servicing business model – for both performing and non-performing
loans – is profitable, and available for all sizes of servicers.
The servicing industry has become highly concentrated today, with 10 companies
responsible for over 70 percent of the servicing market. Some of this concentration is
related to economies of scale, but some may also be related to servicing compensation.
The current servicing compensation structure results in the creation of a mortgage
servicing right asset, which is difficult to manage and is separate from a servicer’s core
competency of servicing mortgage loans. In addition, capital requirements for mortgage
servicing rights will likely increase for many servicers under Basel III. The extent to
which the current servicing compensation structure and alternative structures impact the
economic choices of maintaining a servicing platform is an issue the joint initiative will
be evaluating.

(3) Ensuring that mortgage originators have flexible execution options.
In today’s mortgage market, origination and servicing are closely linked as the value
obtained from mortgage servicing under the current servicing compensation model often
serves as an offset for origination costs. For Enterprise mortgages, an originator has two
choices: retain the mortgage servicing right; or sell or release the mortgage servicing
right. As just discussed, retaining the mortgage servicing right may be problematic for
some institutions. And while selling or releasing the mortgage servicing right provides
an opportunity to monetize value, the value obtained is directly related to the level of
demand from organizations that can hold the mortgage servicing right asset, and
originators also relinquish their relationship with the borrower. The joint initiative will
consider ways to provide flexibility for originators to retain or release mortgage servicing
through other structures that do not mandate the holding of a mortgage servicing right
asset.

(4) Increasing flexibility for guarantors to manage non-performing loans.
The current servicing compensation system was not set up to handle increased volumes
of non-performing loans, which causes problems from both the guarantors’ and
borrowers’ perspectives. A minimum servicing fee that is part of the mortgage note rate
provides income when a loan is performing, but no income for non-performing loans – at
exactly the time that more funds need to be expended. This mis-alignment contributes to
less than optimal servicer performance in foreclosure prevention efforts and hinders the
Enterprises’ loss mitigation efforts. A key focus of the joint initiative will be considering
compensation structures that better align servicer incentives. Put another way, we are
seeking a structure that better aligns the cost of servicing to the servicing compensation
received.

These are only a few of the high level issues that the joint initiative will be considering.
Changes to servicing compensation are complicated and affect several aspects of the
mortgage financing process. Alternatives that the joint initiative may consider include a
fee for service compensation structure for non-performing loans as well as the possibility
of reducing or eliminating the minimum mortgage servicing fee for performing loans.
Many of these issues have been the subject of discussion within the mortgage industry for
years. Those are not the only alternatives, and the joint initiative would welcome the
consideration of others.

FHFA has created a new web page on the FHFA web site for information related to the
joint initiative, and we have posted a background document that compares the most
common alternatives that have been considered in the past. Going forward, FHFA will
coordinate efforts of the initiative over the next several months to gather feedback from
the industry, consumer groups and investors, and from other regulators and government
agencies. FHFA expects that this effort will lead to a proposal for a new single-family
mortgage servicing compensation model that will benefit from broad public input. Any
implementation of a new servicing compensation structure would require a significant
lead time to ensure that all participants in the mortgage finance process have sufficient
time to adjust to any changes. Any such implementation would be prospective in nature
and would not be expected to occur before Summer 2012.

The joint initiative is about developing a servicing compensation model for the future.
Clearly the last few years have posed unprecedented challenges for the servicing
industry, in spite of efforts to expand the resources dedicated to loss mitigation activities
and improve communications with troubled borrowers. While none of us underestimate
the difficulties that servicers face, mortgage servicing, especially of delinquent loans,
must improve.

To address the near-term issues we are facing today with servicing, FHFA has directed
the Enterprises to participate in a separate working group with FHFA. This effort is
focused on aligning the Enterprises’ current servicing standards and establishing
appropriate incentives to encourage and support servicer contact with borrowers in the
early stages of delinquency, when evaluation for loan modification or other foreclosure
alternatives is most effective. While each of the Enterprises has servicing guides and
various procedures in place, greater consistency in servicing practices will ease burdens
on servicers and can build on the best practices developed by each of the Enterprises.
The working group will develop consistent timelines and requirements for
communications with borrowers, including solicitation for foreclosure prevention
options, so that there is no confusion regarding what the two companies expect from
servicers. Early intervention and evaluation are critical and we want to ensure that the
guidelines are clear and simple to apply, to help all servicers provide homeowners in
need with complete and useful information regarding their foreclosure prevention options
as well as the opportunity to make decisions without the undue pressure of a looming
foreclosure sale.

The working group is also developing an incentive structure that will reward servicers for
early engagement, and update the foreclosure processing timelines in recognition of
changes in state and local mandates and practices. Each Enterprises’ work to develop
new standards will now be part of the larger working group effort, and will include
consideration of appropriate penalties to encourage efficient resolution and liquidation of
properties in cases where foreclosure is necessary. The Enterprises will be moving
forward with servicer penalties for last year in the coming weeks, but our goal is to
announce the new set of requirements, timelines, incentives, and penalties by the end of
the first quarter of this year.

Finally, FHFA is closely involved with other government regulators in the process of
developing national servicing standards. The issues we are considering as part of the
joint initiative and the near-term working group are closely related to the process of
developing national servicing standards. This heightened regulatory coordination
between primary and secondary market supervisors should help market participants
operate with more uniform regulatory standards and expectations.

I know that members of the panel about to follow me can expand on the initiatives I have
just described. Thank you again for inviting me to speak here today.

Deal or No Deal ...? $C $BAC $GS $JPM $WFC $MS $UBS $TD $HBC

Da Banks, Deal or No Deal ...?

Who predicted the near collapse of the US financial system? And who predicted its amazing recovery from the abyss? Not many.

As Moody's Investor Service warned last week, three of France's top banks could be in for a credit downgrade as they continue to use cheap US dollar funding to roll their large exposure to Greek debt.

BNP Paribas, Crédit Agricole and Société Générale may all be playing hot potato with debt of a deteriorating quality, borrowing over $75 billion on the short end to finance their longer-term holdings of Greece government paper." Europe on the Brink: Does Their Fall Ensure Our Recession?

6Months Daily Charts

$C Citigroup Inc.


Citigroup Inc. (C) and Goldman Sachs Group Inc. (GS) increased gross exposures to French banks in the year’s first half before the European nation’s financial stocks plunged amid perceived dependence on short-term funding.
Citigroup, the third-biggest U.S. lender, boosted gross“cross-border outstandings” with French banks 40 percent to $15.7 billion from Jan. 1 through June 30, according to the company’s quarterly report. Goldman Sachs increased claims by 31 percent to $38.5 billion in the first half, its report shows. The filings don’t disclose collateral the banks received or hedges, which curb potential losses on existing bets.
Credit Agricole SA (ACA) and Societe Generale SA, France’s second- and third-biggest banks, led a rout in the BloombergEurope Banks and Financial Services Index since the end of June amid concern that some of the region’s lenders may struggle to maintain funding during government-debt crises. Legg Mason Inc.’s bond unit said its U.S. money-market funds won’t buy new debt from French banks to shield themselves from the perceived risk.
“There is a great cloud of uncertainty that’s hanging over the U.S. banks about the full extent of the exposures they have to French and other European banks,” said Andrew Karolyi, a finance professor at Cornell University in Ithaca, New York.“The market is clearly not reacting well to what they’re seeing.”  Boosted Ties to French Banks

$GS Goldman Sachs Group, Inc.


When the analysts’ recommendations are strongly positive but the stock’s price action is very negative great caution should be exercised. Do not follow the herd and buy in to all the Wall Street recommendations. The fundamental projections have wide fluctuations in forecasts and are based on very unreliable numbers. Read this Article

$BAC Bank of America Corp
WARREN BUFFET SAID ...

“Heightened volatility is here to stay,” said Sam Stovall, chief investment strategist for Standard & Poor’s equity research.       

“The markets are much more interconnected than they have ever been, and new players are exacerbating the swings,” he added. Investors’ memories of 2008 are “very fresh and will cause them to sell first and ask questions later.”

Further undermining investor confidence is the fact that nearly all of the Western markets appear to be moving in lockstep, undergoing disruptive episodes simultaneously. That makes it difficult for investors to find a safe place to park their money — hence the rush to cash and other havens like United States bonds and gold — and stirs even more anxiety about interconnected risks between the European and American debt crises.    Wall Street, Dangers Linger

$JPM JPMorgan Chase & Co.


$WFC Wells Fargo & Company


$MS Morgan Stanley


Dr. Doom, Nouriel Roubini, says that more stimulus is needed to grow the economy not austerity. Present policies could produce another recession. Roubini is called Dr. Doom for his pessimistic views. He predicted the earlier recession correctly. Capitalism can destroy itself

$USB U.S. Bancorp


$TD Toronto-Dominion Bank (USA)


$HBC HSBC Holdings


Marc Faber the Swiss fund manager and Gloom Boom & Doom editor spoke Tuesday about the Fed's decision to keep interest rates low for a prolonged period of time and the prospects of QE3. He says the Treasury market is a gigantic bubble and long-dated T-bonds are the short of the century. Faber suggests that sometimes the best the Fed can do for markets is to do nothing!

"The best they could do for markets would be to collectively resign," Faber suggested.
 What Can the Fed Do To Help Markets?

$LULU / $LLL.T $BEBE $PIR $RAD Retail : The Good, The Bad N' The Ugly...?

 Retail : The Good, The Bad N' The Ugly...?
$LULU / $LLL.T $BEBE $PIR $RAD

$LULU lululemon athletica inc.
10Day 15Min Chart
WARREN BUFFET SAID ...

3Months Daily Chart
WARREN BUFFET SAID ...

"The line separating investment and speculation, which is never bright and clear, becomes blurred still further when most market participants have recently enjoyed triumphs. Nothing sedates rationality like large doses of effortless money. After a heady experience of that kind, normally sensible people drift into behavior akin to that of Cinderella at the ball. They know that overstaying the festivities — that is, continuing to speculate in companies that have gigantic valuations relative to the cash they are likely to generate in the future — will eventually bring on pumpkins and mice. But they nevertheless hate to miss a single minute of what is one helluva party. Therefore, the giddy participants all plan to leave just seconds before midnight. There’s a problem, though: They are dancing in a room in which the clocks have no hands." Warren Buffet

$BEBE Bebe Stores, Inc.
10day 15min


3Months Daily


$PIR Pier 1 Imports, Inc.
10day 15min chart


3months daily


$RAD Rite Aid Corp.
10day 15min


3month Daily

Renewable Energy Production Surpasses Nuclear in U.S.

Renewable Energy Production Surpasses Nuclear in U.S.

Erica Gies Green, Like Money Forbes

In the first quarter of 2011, renewable energy production in the United States surpassed nuclear production in overall quantity and percentage. Also, the percentage of natural gas is growing slowly, while coal is declining.


Entrenched energy industries like to say that renewable energy can never provide a significant amount of U.S. energy needs. And while it’s true that some technologies still face barriers to widespread implementation and others, while technically renewable, might not be very green, renewables as a percentage of U.S. energy generation are creeping up steadily — and not just in California, with its target of 33 percent renewables by 2020.

In the first three months of 2011, renewable energy — hydroelectric, geothermal, solar/PV, wind, and biomass — made up 11.7 percent of the U.S. energy production mix, surpassing nuclear at 11.1 percent. The same period last year, nuclear was 11.6 percent, and renewables 10.6, according to a June report from the U.S. Energy Information Administration (Table 1.2).

“The rise in conventional hydroelectric generation was by far the largest absolute “fuel-specific” increase as it was up 10,759 thousand megawatthours, or 52.2 percent,” according to Electric Power Monthly. This was largely due to heavy spring rains in Washington, Oregon, and California, which accounted for 71.5 percent of the national rise.

However, environmentalists find objectionable the two biggest technologies that make up the renewables sector: hydroelectric power at 35 percent and biomass at 48 percent.

While large hydroelectric power doesn’t emit emissions (at least not after accounting for the materials and energy expended in building it), it has harmful impacts on river ecosystems and has therefore fallen out of favor as a power source in the developed world.

As for biomass, there are many types of feedstocks, and each much be evaluated individually for its emissions profile, it’s water footprint, and other considerations, such as whether farm fields or forests need that material to decompose in place to retain soil or ecosystem function.

Wind was next highest at 13 percent of renewables, or 1.5 percent of total U.S. energy production, up from 1.1 percent the same time last year.

This represents a 20.4 percent increase from March 2010, and the third-largest fuel-specific increase, according to the report. “Wyoming, California, and Illinois had the largest gains, but the increase was widespread,” it said.

Natural gas plus natural gas plant liquids were 32.9 percent of U.S. production in the first quarter, a bit up over last year (32.7) and 2009 (32.4).

But overall U.S. generation was up 2.0 percent from March 2010 to March 2011, so in spite of small percentage gains, “natural gas-fired generation showed the second-largest increase over March 2010 as it was up 5.0 percent or 3,131 thousand megawatthours,” said the report. “Increased gas-fired generation in Pennsylvania and Ohio accounted for 78.8 percent of the national jump in gas-fired generation.” It would seem the recent hype about shale gas reserves is bearing some fruit — well, some gas.

Coal is declining, with 29 percent the first quarter of 2011, down from 29.4 percent the same time last year, and 31.1 percent during the same period in 2009.

Death for Bigger Cars Will Mean More Deaths

Death for Bigger Cars Will Mean More Deaths

BY: Stuart Anderson Forbes


When the federal government announces new fuel economy standards for cars later this year here is something you’re unlikely to hear: “And by forcing companies to meet these new, arbitrary standards it will lead to smaller, lighter vehicles and thousands of people will die who otherwise would have lived.”

This is the dirty little secret of those who wish not simply to suggest but mandate car companies do away with larger vehicles to the greatest extent possible. Simply put, bigger vehicles save lives. “The death rate in 1-3-year-old minicars involved in multiple-vehicle crashes during 2007 was almost twice as high as the rate in very large cars,” according to the Insurance Institute for Highway Safety.

Larger vehicles are particularly important for families who desire safety for their children. “The National Research Council concluded in 2002 that 1,300 to 2,600 additional crash deaths occurred in 1993 because of vehicle weight reductions to comply with federal standards,” notes the Insurance Institute. “Car size and weight are crucial to protecting people in crashes.” Particularly since at least half of crashes do not involve other vehicles, forcing more people to drive smaller cars would simply mean more deaths, beyond the impact of head-on collisions.

Sam Kazman of the Competitive Enterprise Institute points out the latest research from the Insurance Institute for Highway Safety shows SUVs (sport utility vehicles) over 4,500 pounds have a one-third lower death rate than cars below 2,500 pounds.

However, as the Wall Street Journal (July 7, 2011) reported, “Future U.S. government fuel economy regulations could saddle auto makers with steep fines or even bar the sale of certain models.” The Obama administration is planning to “roughly double the corporate average fuel economy from current fleet levels to 56.2 miles a gallon by 2025.” Phasing in the new rules would start within 6 years.

The federal government already fines auto companies for, in essence, selling cars that Americans want to buy, rather than meeting the preferences of what amounts to government overseers of the auto industry. Companies view these fines as the price of doing business. But the Wall Street Journal noted, “Bigger fines could significantly raise the cost of vehicles. And there is a chance car makers would not be able to sell in the U.S. their least-efficient models, typically large sedans or SUVs with eight-cylinder engines.”

Some argue these new standards are important for the environment. But economist Bjorn Lomberg has pointed out that even if everyone in America drove a Prius the environmental impact would be negligible.

Others argue the new rules would reduce our “dependence on foreign oil.” The problem with that argument is to the extent America is “dependent” on foreign oil, it’s only because Congress and the President have not supported greater exploration in the United States.

More importantly, it makes no sense to argue we need higher fuel economy standards to prevent oil imports. The “United States” does not import large amounts of oil as a government entity. Instead, the decision to buy gasoline for our cars is made by millions of consumers every day. If many consumers choose to spend their money on gas to fill up the tank of a larger vehicle, rather than spend the money on, for example, a new flat-screen TV, then that’s the business of individual Americans – not the federal government.

A good reason why a father or mother may wish to buy a larger vehicle is because they care about the lives of their children, and (obviously) care about them more than anyone who works in the Environmental Protection Agency.

Here is a suggestion for Congress: an amendment or bill that states the following: “New standards for fuel economy cannot go into effect unless it is demonstrated such standards are unlikely to increase traffic fatalities, including the deaths of child passengers.” That would make the tradeoff clear for all Americans.

Parabolic SAR Trading

Parabolic SAR (Stop and Reverse) another great indicator for swing trading or trend recongnition ...


Investopedia explains Parabolic Indicator
This method was developed by J. Wells Wilder. Basically, if the stock is trading below the parabolic SAR (PSAR) you should sell. If the stock price is above the SAR then you should buy (or stay long). Read more...

How to Trade Bollinger Bands

Bollinger Bands or you messure of volitliy is another indicator I use and most my charts ...


Investopedia explains Bollinger BandBecause standard deviation is a measure of volatility, Bollinger bands adjust themselves to the market conditions. When the markets become more volatile, the bands widen (move further away from the average), and during less volatile periods, the bands contract (move closer to the average). The tightening of the bands is often used by technical traders as an early indication that the volatility is about to increase sharply.

This is one of the most popular technical analysis techniques. The closer the prices move to the upper band, the more overbought the market, and the closer the prices move to the lower band, the more oversold the market. Read more... 

Intraday Bollinger Trading

Trend Trading ADX Indicator Video Tutorial

ADX: The Trend Strength Indicator
Trading in the direction of a strong trend reduces risk and increases profit potential. The average directional index (ADX) is used to determine when price is trending strongly. In many cases, it is the ultimate trend indicator. After all, the trend may be your friend, but it sure helps to know who your friends are.Read more:


ADX Indicator


This a great tool and Indicator to use in conjunction with Others

HOW TO TRADE THE SLOW STOCHASTIC INDICATOR LIKE A PRO

This is a tool I use on all my charts The Slow Stochatics


Part 2


Part 3


Stochastic Oscillator
What Does Stochastic Oscillator Mean?
A technical momentum indicator that compares a security's closing price to its price range over a given time period. The oscillator's sensitivity to market movements can be reduced by adjusting the time period or by taking a moving average of the result. This indicator is calculated with the following formula:

%K = 100[(C - L14)/(H14 - L14)]

C = the most recent closing price
L14 = the low of the 14 previous trading sessions
H14 = the highest price traded during the same 14-day period.

%D = 3-period moving average of %K

Investopedia explains Stochastic Oscillator
The theory behind this indicator is that in an upward-trending market, prices tend to close near their high, and during a downward-trending market, prices tend to close near their low. Transaction signals occur when the %K crosses through a three-period moving average called the "%D". Read more


Part 4


Part 5


Part 6

'Solar Impulse' Video: Plane takes off & flies exclusively on sunlight

Impressive, Incredible and a glimpse to where we are headed Clean renewable energy is the future...


Bad Things That Penny Stock Comapny's Can Do To Investors ...


-The Bad -


What is 'Dilution'?

-'Dilution' is the issuance of additional shares to the 'outstanding share count'. While not such a bad sounding definition, the impact of dilution can ruin a shareholder's position in a stock. The additional shares effectively 'dilute' the value of all shares on the market. Think of it like a pizza. The pie represents the market valuation of the company, while the slices represent the individual shares of the company's stock. When the company sells new shares, the pie doesn't get bigger, the slices simply get smaller. The investor is left with smaller slices.. or.. cheaper shares. Dilution Definition

The direct effect of selling new shares can often be far more damaging than the proportional increase in shares warrants. Selling shares on the open market drives down the price; supply is increased, while demand stays the same. Without care a company can send their stock into a diluted spiral that is very damaging to shareholders.

The purpose of dilution is for the company to raise money, plain and simple. In the grand scheme, the purpose for a company to go public in the first place is to provide a means for raising capital. You must find companies that do so in a responsible manner, without hurting shareholders. Always keep this in mind when trading any stock, and you will fall victim to dilution far less often.

What is a 'Reverse Split'?


-A 'Reverse Split' (or R/S, RS) is a method by which a company reduces the number of shares on the market and increases the stock price proportionally. Reverse splits are done at a specific ratio: ie - 10 for 1, or 10:1. This ratio would mean that if a shareholder held 1000 shares at 1 cent, after the reverse split the shareholder would be left with 100 shares at 10 cents each. The value of the position does not change from the reverse split... at least not directly from it.

Companies usually do a reverse split to increase the price of the stock to more attractive levels, or to remain at a minimum price for a particular exchange. While not necessarily a bad thing, a R/S is a popular method that bad penny stock companies use to continue raising capital through dilution. 'Dilution', if done enough, will eventually leave a stock virtually worthless. The price may go as low as .0001 dollars, the minimum that stocks are tradable by common investors. At this point the company can no longer effectively raise capital by selling more shares.

By performing an R/S, the number of shares on the market decrease, and the price increases back to a "dilutable" level. The dilution starts again, and the cycle can continue over and over. Because of this, a black cloud is associated with the R/S. They normally result in a large selloff by remaining shareholders, causing the price to plummet, and the shareholder value to follow suit.

A reverse split is very rarely an opportunity for a safe investment, and certainly not a wise choice for a beginner in penny stocks. To protect yourself from purchasing the stock of a company with a history of abusive reverse splits, check out this iHub board and scan through the list.: Reverse Split Repeat Offenders Listing

What is a "Gagged" Transfer Agent?

-A 'Transfer Agent' is a company's means of managing shareholder records, issuing and canceling stock certificates, and processing investor mailings. Some companies can act as their own transfer agent, but most often, especially with penny stocks, the job is outsourced to companies specializing in the business. Transfer agents are normally the most accurate, and often the only way of finding the current O/S, A/S, and float for a penny stock. Some will require a fax with shareholder details to retrieve the information, others simply a phone call or email. This type of transparency is desirable among investors.

A "Gagged" transfer agent is one which has been instructed by the company they are working for to not release information, such as the share structure. This is usually NOT a good situation. There is no legitimate reason for a company to gag their TA. It is almost always done to hide dilution. Some TA's, however, have a policy against releasing share structure information. The reasoning behind this is to keep the thousands of penny stock traders from bogging down their business with requests for information. Unfortunately this forces the shareholder to contact the company for information. While this isn't as bad as a company specifically gagging their TA, it still isn't an ideal scenario. Whether the company sought out this TA because of this policy, or it was a coincidence, is up for debate.


Without knowing the current number of outstanding shares, an investor has no idea if shares are being sold by the company. Concurrently, without knowing the number of authorized shares, the number of shares that can possibly be sold is not known either. Companies that practice this scam will often issue press releases, or other investor communication containing excuses for having the TA gagged. Unknowing investors will buy these up, and continue holding shares, or even buying more. We do not recommend touching a stock with a gagged TA, unless you are experienced with penny stocks, and it is purely a short term momentum play.

Swing Trading Fibonacci Time Zones Fibonacci retracement

Fibonacci Number

The Fibonacci sequence is named after Leonardo of Pisa, who was known as Fibonacci. Fibonacci's 1202 book Liber Abaci introduced the sequence to Western European mathematics,[2] although the sequence had been described earlier in Indian mathematics.[3][4][5] (By modern convention, the sequence begins with F0 = 0. The Liber Abaci began the sequence with F1 = 1, omitting the initial 0, and the sequence is still written this way by some.)
From Wikipedia, the free encyclopedia


What is , and where do the ratios that are used come from?

Fibonacci retracement is a very popular tool among technical traders and is based on the key numbers identified by mathematician Leonardo Fibonacci in the thirteenth century. However, Fibonacci's sequence of numbers is not as important as the mathematical relationships, expressed as ratios, between the numbers in the series. In technical analysis, Fibonacci retracement is created by taking two extreme points (usually a major peak and trough) on a stock chart and dividing the vertical distance by the key Fibonacci ratios of 23.6%, 38.2%, 50%, 61.8% and 100%. Once these levels are identified, horizontal lines are drawn and used to identify possible support and resistance levels. Before we can understand why these ratios were chosen, we need to have a better understanding of the Fibonacci number series. (For a more in-depth discussion of this subject, see Fibonacci And The Golden Ratio.)

The Fibonacci sequence of numbers is as follows: 0, 1, 1, 2, 3, 5, 8, 13, 21, 34, 55, 89, 144, etc. Each term in this sequence is simply the sum of the two preceding terms and sequence continues infinitely. One of the remarkable characteristics of this numerical sequence is that each number is approximately 1.618 times greater than the preceding number. This common relationship between every number in the series is the foundation of the common ratios used in retracement studies.

The key Fibonacci ratio of 61.8% - also referred to as "the golden ratio" or "the golden mean" - is found by dividing one number in the series by the number that follows it. For example: 8/13 = 0.6153, and 55/89 = 0.6179.

The 38.2% ratio is found by dividing one number in the series by the number that is found two places to the right. For example: 55/144 = 0.3819.

The 23.6% ratio is found by dividing one number in the series by the number that is three places to the right. For example: 8/34 = 0.2352.

For reasons that are unclear, these ratios seem to play an important role in the stock market, just as they do in nature, and can be used to determine critical points that cause an asset's price to reverse. The direction of the prior trend is likely to continue once the price of the asset has retraced to one of the ratios listed above. The following chart illustrates how Fibonacci retracement can be used. Notice how the price changes direction as it approaches the support/resistance levels.

Read more: investopedia